Stemilt Growers and its long-time industry leading category management programme, FruitTracker, is delivering national category insights in a new infographic format.
The first 'Stemilt-O-Graphic' was released on Monday 1 December, reporting on apple category performance across the US for the month of October 2014, comparing Nielsen scan data to data from the same timeframe the prior year.
According to Stemilt marketing director Roger Pepper, the Stemilt-O-Graphic was designed to give a high-level look at apple category performance across the US and relies on infographics to compare the two periods.
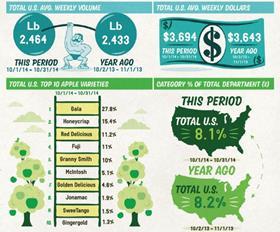
“The first issue of our Stemilt-O-Graphic shows that apples were once again a big part of the produce department in October 2014,' explained Pepperl. 'On average, apples accounted for 8.1 per cent of total department dollars in October, with Gala, Honeycrisp, and Red Delicious leading the way among varietals.
'Additionally, more than two-thirds of apples were sold as bulk in October,' he added. 'This is an important sign of overall category health as bulk sales historically drive more dollars to the department than bags because of their higher retail price.”