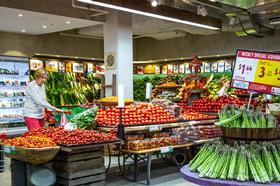
Australia has an abundance of fresh produce, with 98 per cent of fruit and vegetables available for commercial consumption produced locally (within Australia). Imported produce fulfils seasonal shortages and counter seasonal demand.
The bottom line is there is no shortage. Rains came at a good time in February, providing much needed relief for crops being harvested or planted through the next few months.
Last year, Australian growers produced over 5.5m tonnes of fresh fruit and vegetables, with potatoes, tomatoes, bananas, apples, oranges and carrots among the highest volumes. While Australia exports around 20 per cent of its fresh fruit and 8 per cent of its fresh vegetables, imports account for around 2 per cent of what the country consumes.
Therefore, the trend of ‘panic buying’ sweeping the country is counterproductive. Consumers may end up with too much fresh produce to consume before it is no longer fresh, creating an increase in food waste.
Economics of supply and demand are also at play. The abnormally high demand from panic buying creates a temporary short supply that drives prices up to slow the demand. The supply chain is well geared for ‘normal’ levels of demand through the year.
In the short-term, there is likely to be some movement in the supply chain with providers looking to supply fresh produce retailers rather than the food service sector, due to the forced closure of many restaurants. However, there is no need to panic buy. The highly efficient supply chain quickly adjusts to service the demand from retailers.
Australian fresh fruit and vegetables
| Product | 2018/19 production (tonnes) | 2019 export(tonnes) | 2019 import (tonnes) | Available for consumption (tonnes)* | Share locally produced (rounded-up) |
| Potatoes | 1.18m | 45,930 | 0 | 1.14m | 100% |
| Tomatoes | 386,376 | 737 | 962 | 386,601 | 100% |
| Bananas | 373,931 | 129 | 51 | 373,853 | 100% |
| Apples | 310,875 | 4,251 | 578 | 307,202 | 100% |
| Onions | 278,938 | 47,648 | 6,980 | 238,270 | 97% |
| TOTAL (all fruit & veg) | 5.58m | 782,153 | 119,392 | 4.92m | 97.6% |
* available includes for processing (incl. juicing, freezing, canning) if applicable
Source: FAOSTAT, ABS 7121, ITC Trademap, Horticulture Statistics Handbook; Fresh Intelligence analysis


