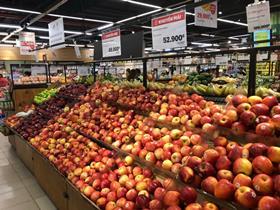
Lying next to each other on the shelves of one of the largest supermarkets in Ho Chi Minh City is a diverse range of apples. Like in any other supermarket, a simple, small whiteboard states the variety and origin of each apple (often labelled incorrectly), along with the selling price. In this sea of sameness, how can apple companies and producers break out of the commodity trap and differentiate their products from the rest of the market?
Methods of measurement and evaluation
To help Vietnamese and global fruit producers find the answer, Fresh Studio began executing monthly surveys to evaluate the presence of fresh fruits in supermarkets in Ho Chi Minh City. Since August 2018, the Fresh Studio survey has tracked the products according to five main characteristics: category (e.g. apple, orange, grape), origin, variety (based on plu codes), packaging (e.g. loose, packed) and brand (based on logos).
These characteristics reflect how the products are normally seen through the customers’ eyes. A uniform method of measuring shelf space was developed to capture the area in which the products are being displayed. On a monthly basis, a team of enumerators record two indicators for each product: its display area (in square metres) and its selling price (in Vietnamese dong).
The fruit aisles of 80 supermarket stores belonging to the 16 biggest supermarket chains were scanned in five periods: August-September 2018, September-October 2018, October-November 2018, November-December 2018 and December 2018-January 2019.
The importance of apples
Covering a total area of 875m2 on average, over the periods studied, imported fruits occupied a relatively competitive share of shelf space (39 per cent) compared to their domestic counterparts (61 per cent). The imported fruit section is mainly comprised of five key categories – apples, grapes, kiwifruit, pears and oranges – which represent 96 per cent of the total imported fruit section. The other 4 per cent is made up of blueberries, cherries, strawberries and tangerines.
Apples maintained the leading position over the observed periods, with an average 48 per cent of the total imported fruit section. There was a downward trend in apple shelf share from 53 per cent (August-September) to 43 per cent (November-December), but the category gained back its weight in December-January (51 per cent).
Seasonal supply swings
The apple category is a highly competitive category with a very high degree of diversity with respect to origin, variety and brand. To begin, the entire period studied saw the shift in sourcing from apples of a Southern Hemisphere origin to a Northern Hemisphere origin as the seasons changed. Thus, in August-September, New Zealand was the dominant origin, representing 79 per cent of apple shelf space.
As the New Zealand season wound down and the Northern Hemisphere season picked up, producers from the north were able to increase their shelf share. Apples from the US picked up the largest portion of shelf space as New Zealand suppliers withdrew, gradually increasing their share to 54 per cent in December-January. By January, French apples (15 per cent) had also gained importance, as had Canada (6 per cent) and Japan (5 per cent).

The competition between apple brands
The diversity of the category is further emphasised by the 61 different apple varieties reported across the five periods. To compare, there were 23 varieties of grapes and only four orange varieties.
Despite the significant change in apple varieties, the top five varieties always took at least one third of the apple shelf space. By December/January, the market concentration had increased, and the top five varieties grew to 47 per cent. While there was rotation in the apple category in every period, Envy, Gala, Red Delicious, Royal Gala and Jazz maintained their positions in the top five ranks for more than two periods.
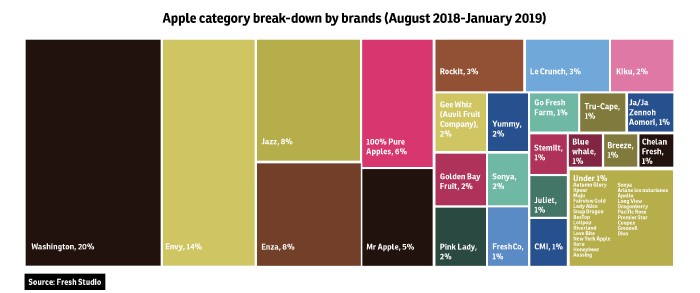
A review of apple brands also highlights the apple’s large offering in the market. Over the periods studied, 96 per cent of the apple shelf space was filled with branded apples, of which 51 different brands were represented. In comparison, only 28 per cent of the grape category and 62 per cent of the orange category were branded.
Tips from the top five
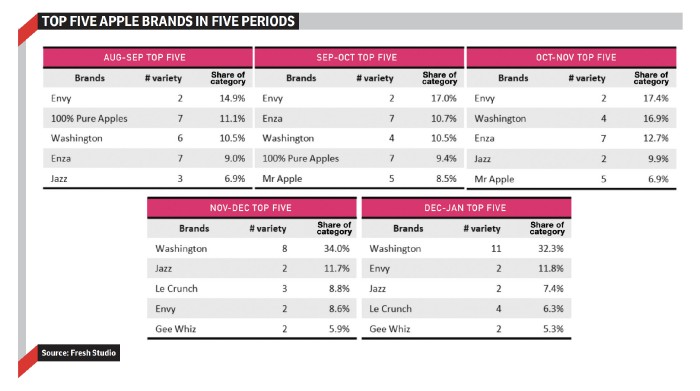
The top five brands not only found prominent spots on the retail shelves, they also increased their share of shelf space from 52 per cent (August-September) to 68 per cent (December-January). These high-ranked brands appear to share some common features.
First, they are imported from either New Zealand or the US, except for the French origin Le Crunch brand.
Second, many of the top brands either offered a range of varieties or diversity in packaging. For example, 11 varieties were branded under the Washington brand including Red Delicious, Gala, Granny Smith, Fuji, Jonagold, Ambrosia and Autumn Glory.
Except for Envy apples, the top five brands were priced lower than the average apple price. In fact, they were even priced lower than the average price of all apples coming from the same origins. Apple competition in Vietnam – it’s something you can really sink your teeth into.

This article originally appeared in the Autumn edition of Asiafruit Magazine.


